Search Artists
 Search Disciplines
 Search
Places
Search
Places Stichting TENT Circustheater Producties
 Education
 Denmark

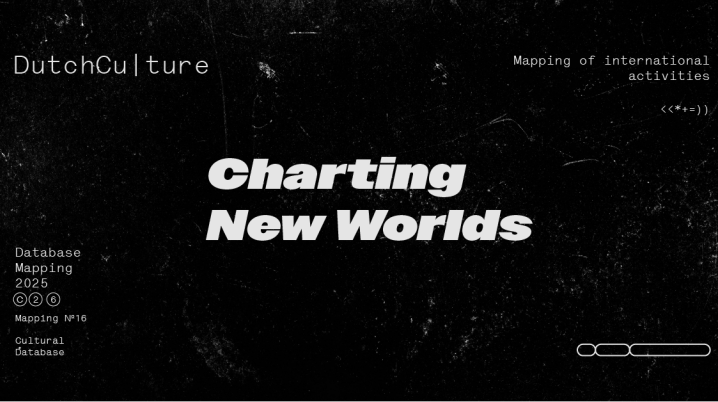
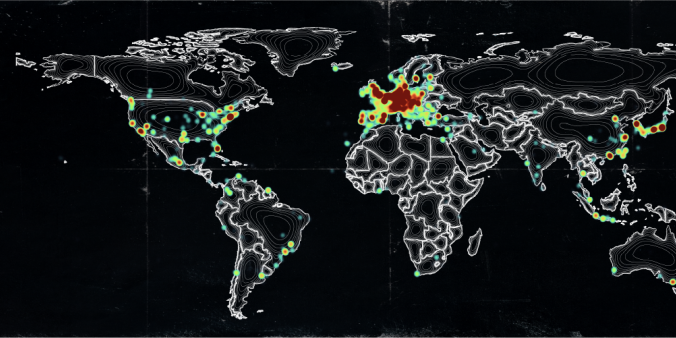
Each year, we add international cultural activities to our Cultural Database, covering work across all artistic disciplines by cultural and creative professionals, organisations and makers based in or from the Kingdom of the Netherlands. This helps us understand the Netherlands' cultural impact around the world. Each year we create a mapping showing an overview of where makers have been travelling over the year.
2025 was on par with 2019 as a record year for international activities. Despite increasing challenges associated with working internationally, including political tensions and funding uncertainty, makers are more active than ever. They are topping the charts and charting new worlds.
Highlights in 2025
In 2025, we tracked more than 19,000 global projects across nearly 3,000 cities in 117 countries. Activity is now back at the level of 2019, the previous peak year. This is a signal that the international cultural sector continues to strengthen and grow, despite the challenges of previous years. We added more than 4,600 new international venues and partners, and more than 1,100 new makers to the database (8% growth).
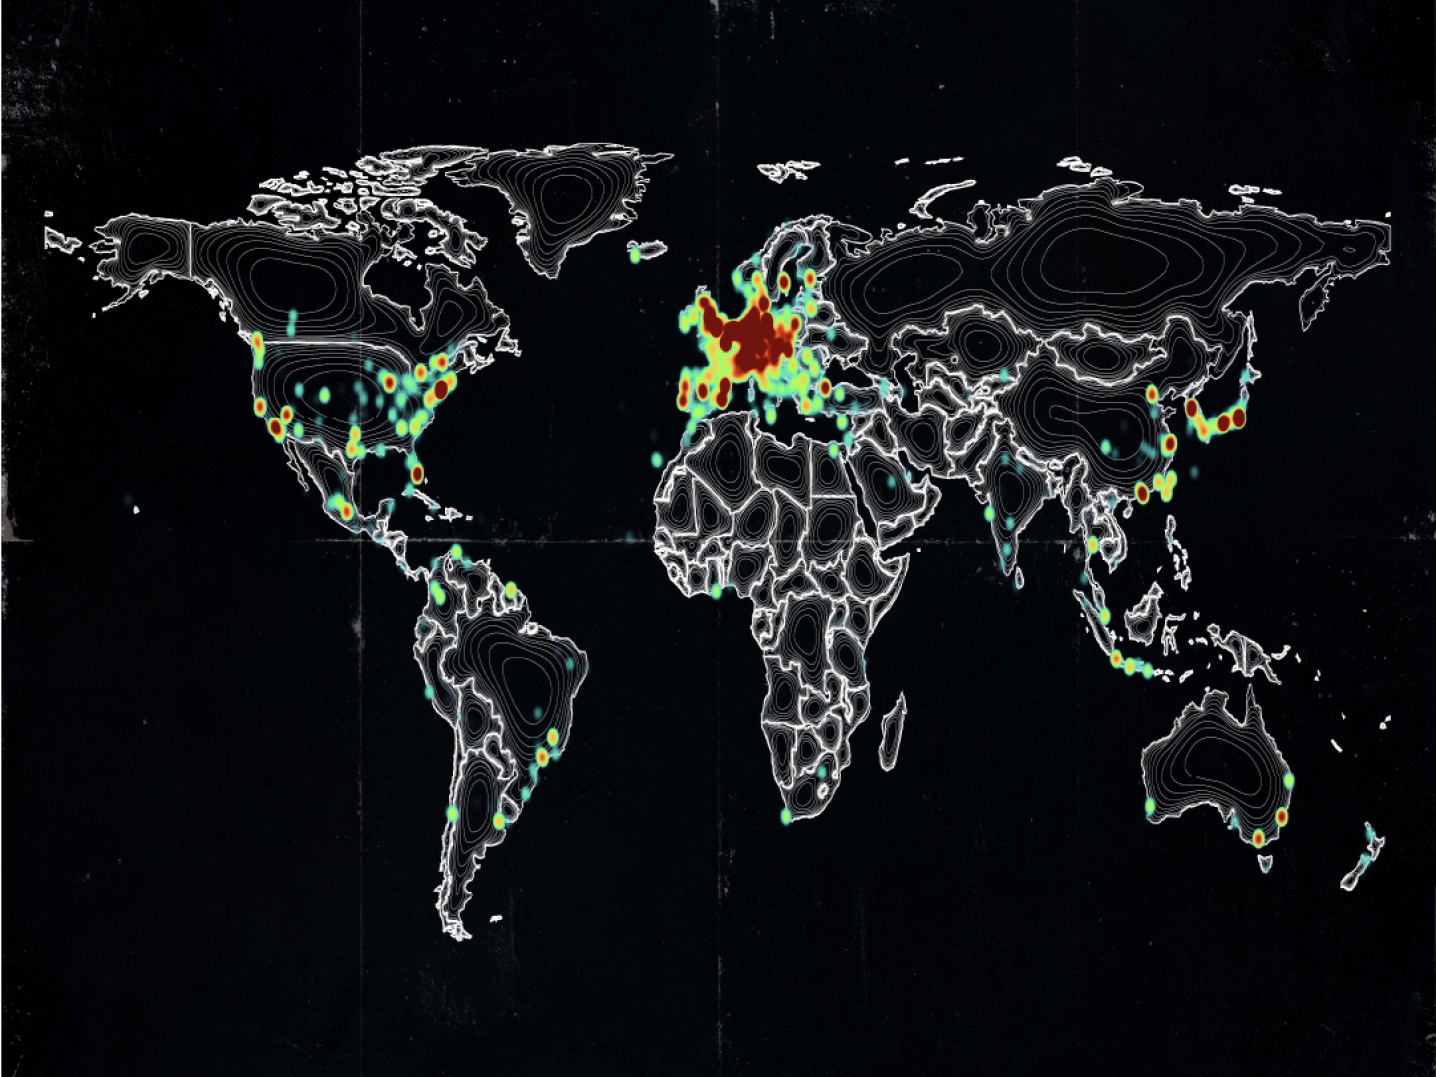
Top 50 Countries in 2025
| 1 | Germany | 11 | Austria | 21 | Czechia | 31 | India/Ireland | 41 | Singapore |
| 2 | USA | 12 | Poland | 22 | Hungary | 32 | Lithuania | 42 | Chile |
| 3 | UK | 13 | Canada | 23 | Mexico | 33 | Thailand | 43 | Serbia/UAE |
| 4 | France | 14 | S. Korea | 24 | Indonesia | 34 | Colombia | 44 | Morocco |
| 5 | Belgium | 15 | Australia | 25 | Norway | 35 | Luxembourg | 45 | Iceland/N. Zealand |
| 6 | Japan | 16 | Denmark | 26 | Croatia | 36 | Argentina/Slovenia | 46 | Cyprus |
| 7 | Spain | 17 | Sweden | 27 | Greece | 37 | Slovakia | 47 | Aruba |
| 8 | Italy | 18 | Portugal | 28 | Taiwan | 38 | Bulgaria | 48 | Ghana/Malta |
| 9 | China | 19 | Türkiye | 29 | Finland | 39 | Suriname | 49 | Egypt |
| 10 | Switzerland | 20 | Brazil | 30 | Romania | 40 | South Africa | 50 | Cuba |
Provinces and Cities
In 2025, more than 3,000 makers across all 12 provinces were internationally active. This is a 12% increase compared to the previous year. We tracked active makers across 194 Dutch cities and towns.
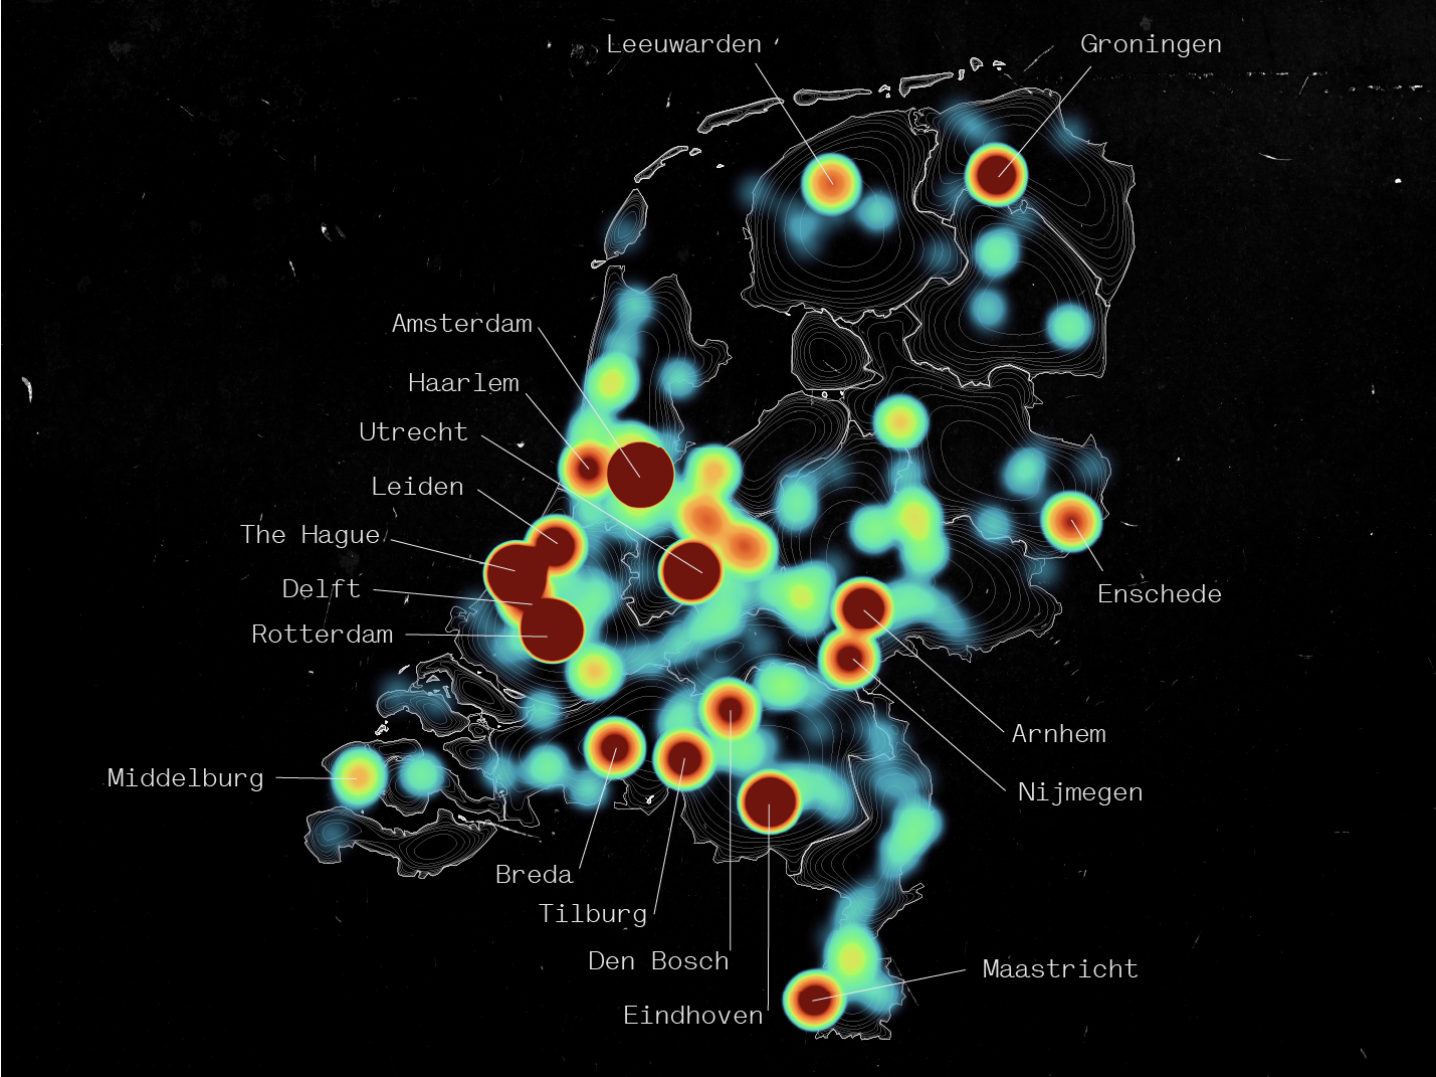
Number of makers per province in 2025
| Drenthe | 14 |
| Flevoland | 11 |
| Friesland | 29 |
| Gelderland | 124 |
| Groningen | 41 |
| Limburg | 53 |
| North Brabant | 165 |
| North Holland | 1537 |
| Overijssel | 32 |
| South Holland | 646 |
| Utrecht | 198 |
| Zeeland | 13 |
Country Factsheets
In tandem with the annual database mapping, we also produce factsheets for the focal countries, providing a quick overview of the activities that took place in each country in the previous year.
Are you a maker?
Are you an artist or cultural professional from or based in the Kingdom of the Netherlands, working on international projects or with partners abroad? If so, you can add your activities directly to the database via a MyDC Account.
Partners
To create this mapping and sustain the DutchCulture Database, we work directly with our partners at the Dutch embassies, consulates and cultural funds, and with makers, cultural organisations and professionals. We thank them for their contributions to the Cultural Database.