
By Renske Ebbers and Erin Chang
“It is a capital mistake to theorise before one has data.”
Those are the words that Arthur Conan Doyle gives Sherlock Holmes to speak in A Scandal in Bohemia (1891). Whether we are playing detective on past events, or researching for the future, it makes sense to start with the facts before outlaying our plans. Growing stronger in our role as the network and knowledge organisation for international cultural cooperation, data analysis plays an important role in the work of DutchCulture.
Next to debates with expert opinions, one-on-one advice for cultural makers and great examples of Dutch art abroad, it is the data that takes up an important part of our time. It is the basis from which we theorise about the impact of Dutch cultural activities abroad. The colourful schemes and graphics provided by DutchCulture data analyst Erin Chang, not only make the abundance of Dutch cultural activity abroad tangible, it lifts the mystery of international cultural cooperation and gives you clues for planning ahead. We proudly present the DutchCulture Database analysis 2018.
Policy leads the way
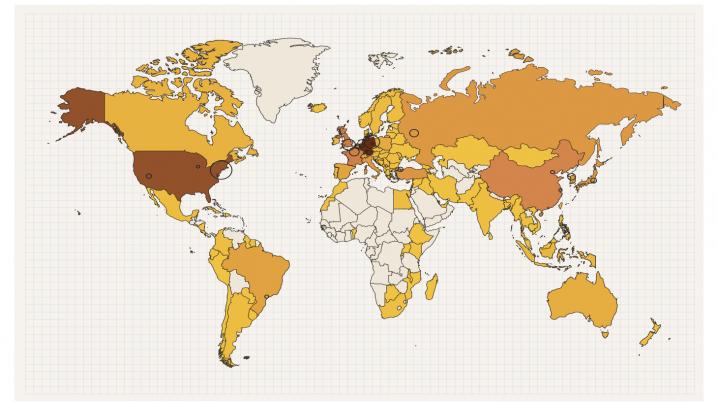
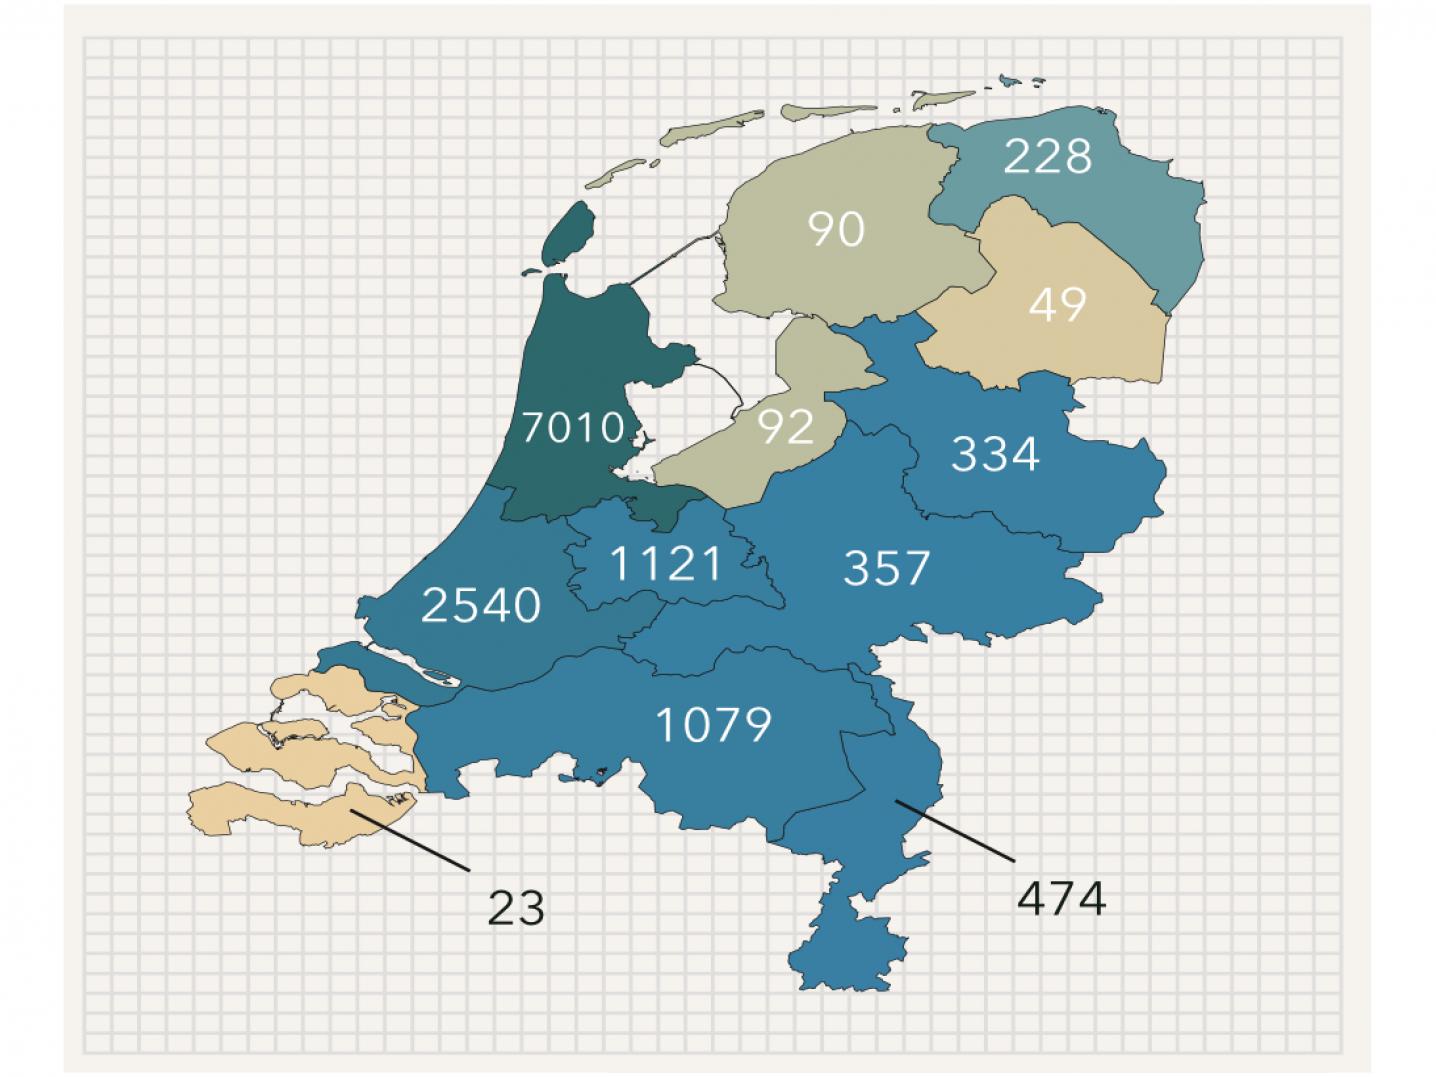
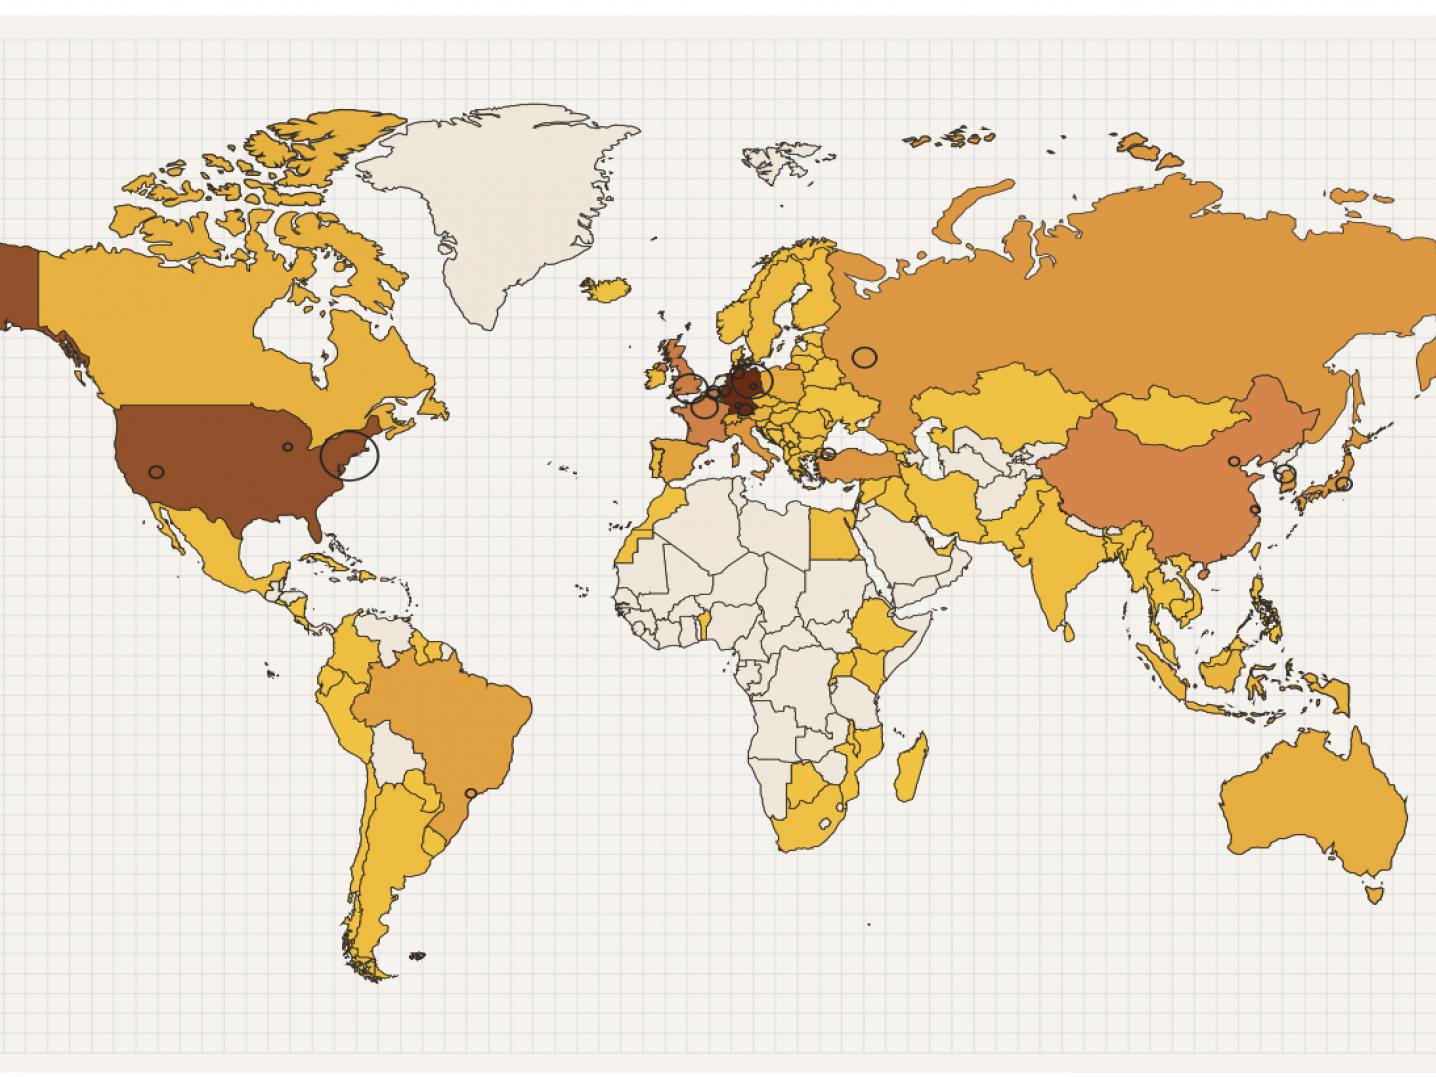
If the data collection process is thorough and objective, the results will be unveiling. The first two images of our 2018 analysis clearly show an uneven regional distribution of cultural makers in the Netherlands producing international activities (figure 1); and international venues programming these activities in countries abroad (figure 2). The distribution of Dutch culture to the countries in South America and especially Africa shows a lot of potential for growth. An explanation for the way Dutch culture is currently distributed across the globe, can be found in the figure underneath. Figure 3 shows which countries are included in the Dutch International Cultural Policy. It is easy to see the direct link between countries with a priority to the Dutch government and their placing on the list.
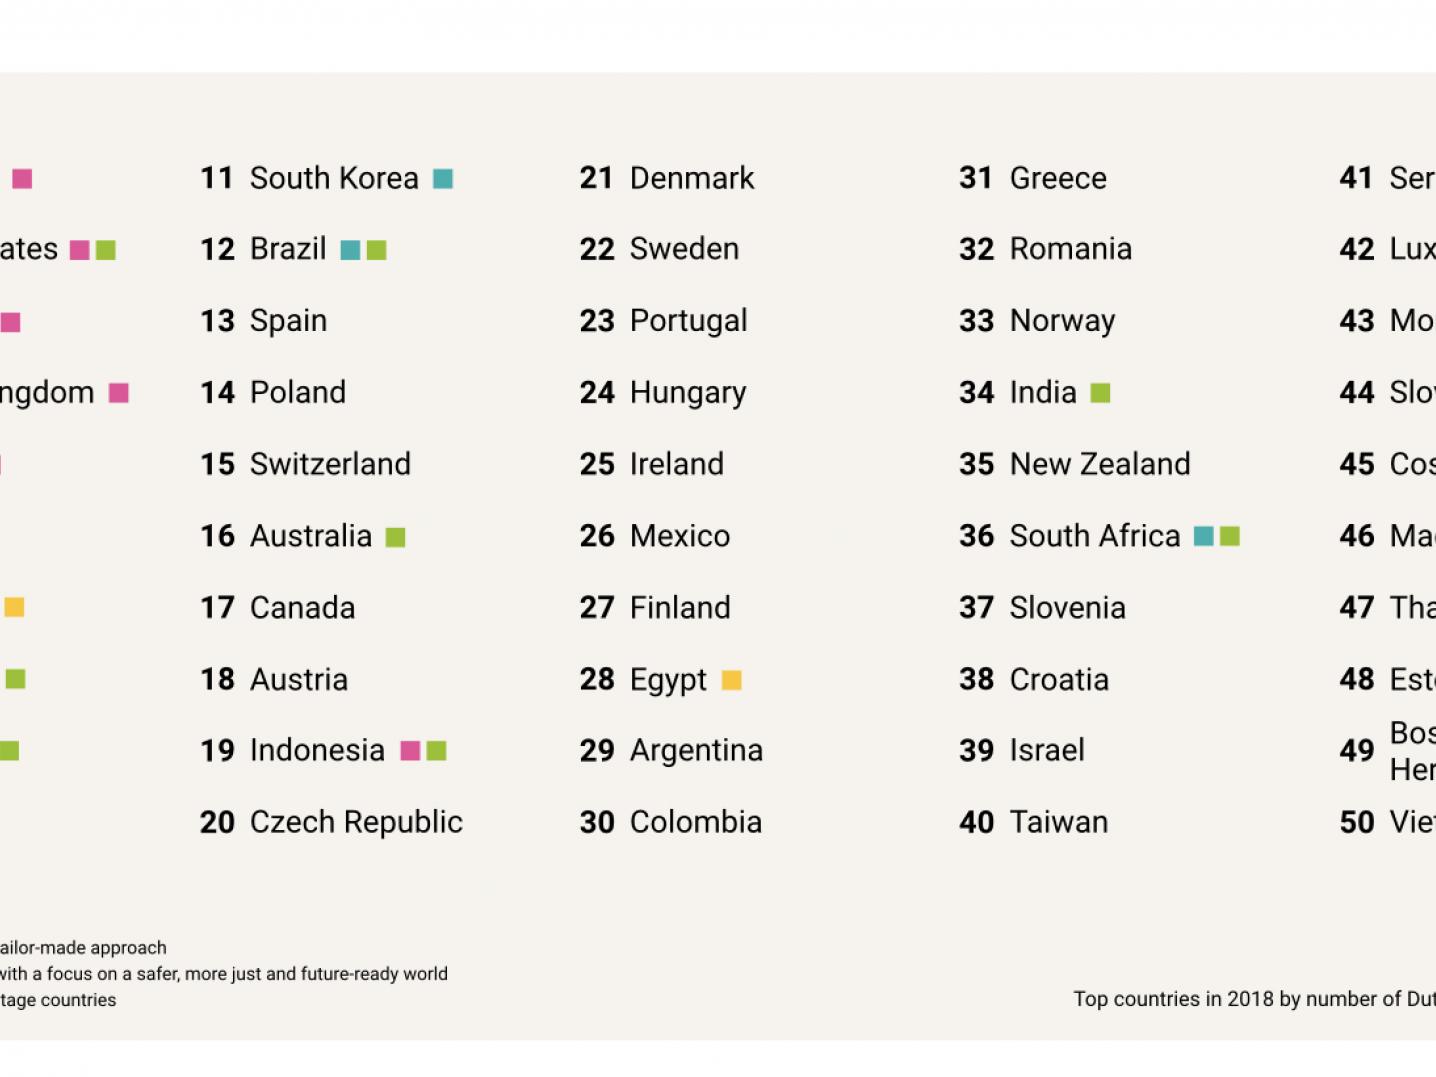
Even though it makes practical sense to perform your activities in countries within Europe, countries further away that have a policy priority also do very well in the list (U.S.A. at number two and China at number six). The first country to make the list without being included in the international cultural policy is Spain at number thirteen. The first (northern) African country is Egypt at number 28, a country which receives special focus in the current policy by the Dutch government.
Figure 2 might show an uneven balance in the global spread of Dutch activities, it also confirms the impact and importance of the international cultural policy that we operate with. It is also inevitable to realise that we have more access to data from countries with a priority in the Dutch cultural policy, and that there will always be Dutch cultural activities taking place around the world without our knowledge. Taking the way we receive data into account, they give us clues for planning ahead, by showing us both our strong suits and potential for growth.
From the same perspective we can look at the origins of Dutch international culture in the Netherlands. The scale is clearly tipping over to the mid-west part of the country, with artists living in big cities like Amsterdam, The Hague and Rotterdam. Figure 1 shows the facts that many policy makers already know, and confirms the widespread efforts to include all regions in international cultural collaboration.
Historic ties and jumping the line
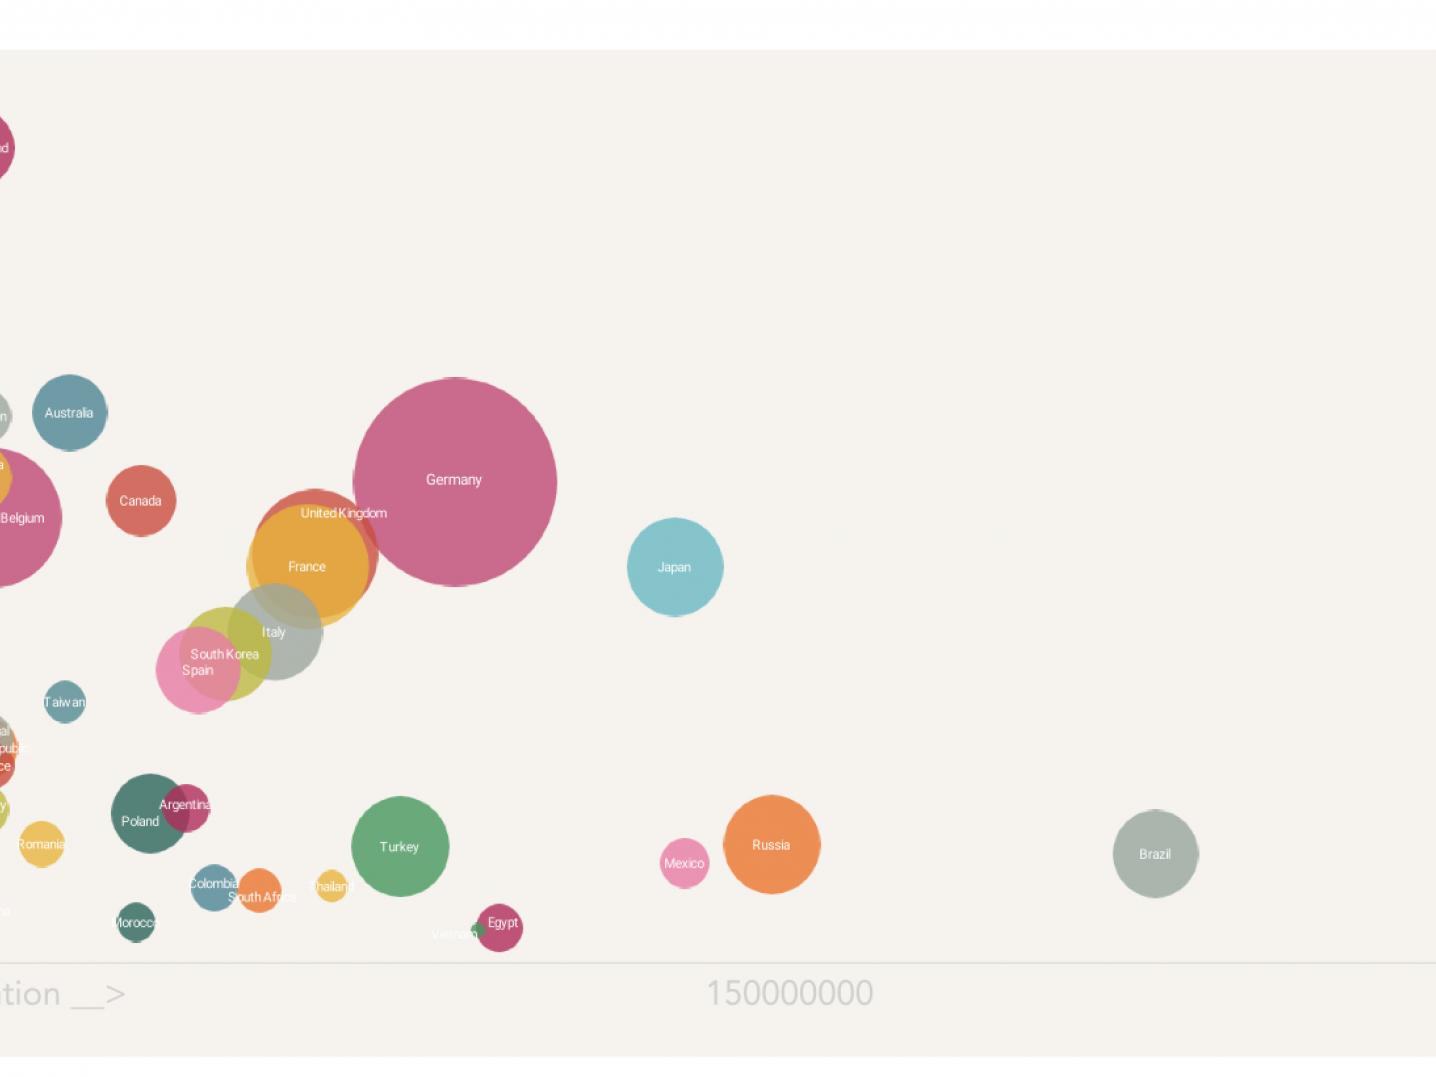
The correlation between a country’s wealth, population and number of Dutch cultural activities is a topic that cannot go unmentioned when presenting our 2018 data analysis. All international activity is influenced by the distribution of wealth across the world and access to culture is tied to this subject. The relation is however not as linear as one could assume, which figure 4 shows us. The historic relationship for example between the Netherlands and countries tied to its colonial history, debouches into a richness of activities related to our shared cultural heritage. Thanks to programmes emphasising shared cultural heritage, cultural exchange between the Netherlands and other countries transcends matching infrastructures and relies on historic and cultural relations as well.
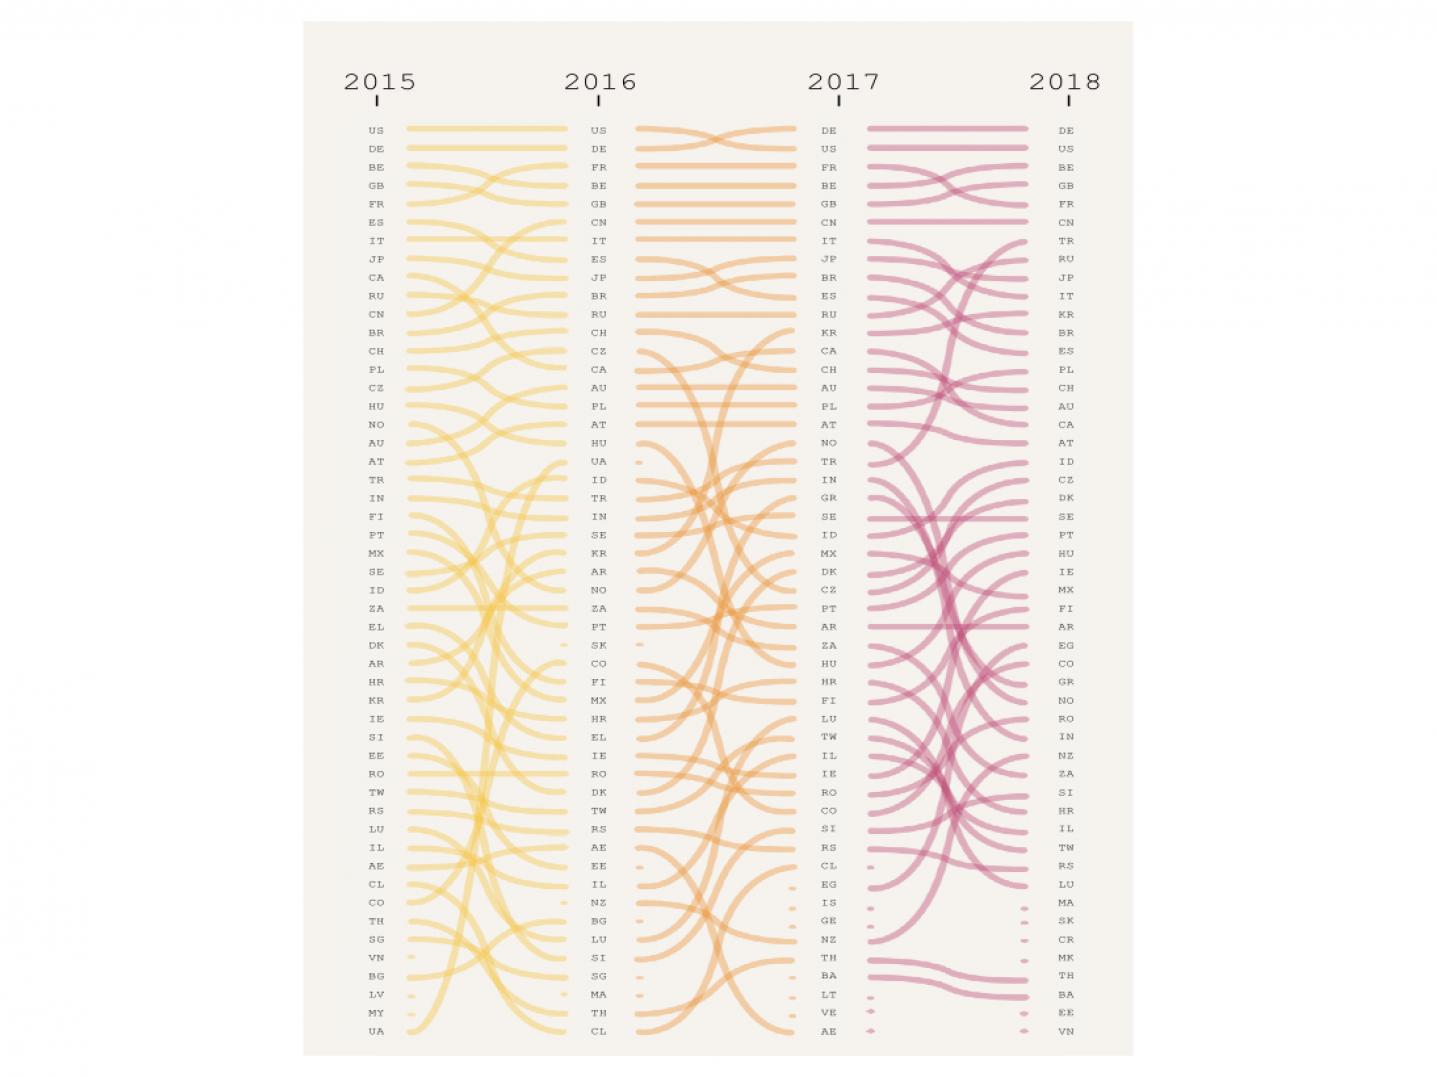
Figure 5, the artwork with the orange, yellow and pink lines, gives us a timeline of the most visited countries in the past three years. Even though the countries on the top of the list remain stable, more to the middle and bottom of the list huge changes have come through, with countries rising as much as 21 places. With just one look at the jumping and sinking lines of this organic figure, it is safe to say that when it comes to the distribution of Dutch cultural activities abroad, flexibility and change is inevitable.
Differences per discipline
An important aspect of our DutchCulture database should be put in the front light at this moment, and that is the division of activities into different artistic disciplines. In the list of most visited countries or cities the activities from all the disciplines are accumulated. The DutchCulture database looks at quantitative data and therefore every activity is worth the same; whether it is a one-hour concert done by a band on tour, or a solo exhibition with the duration of a month. Cultural makers are often looking to research the trends in their own discipline however, so we detangle this accumulation of activities, and have a look at the disciplines on their own.
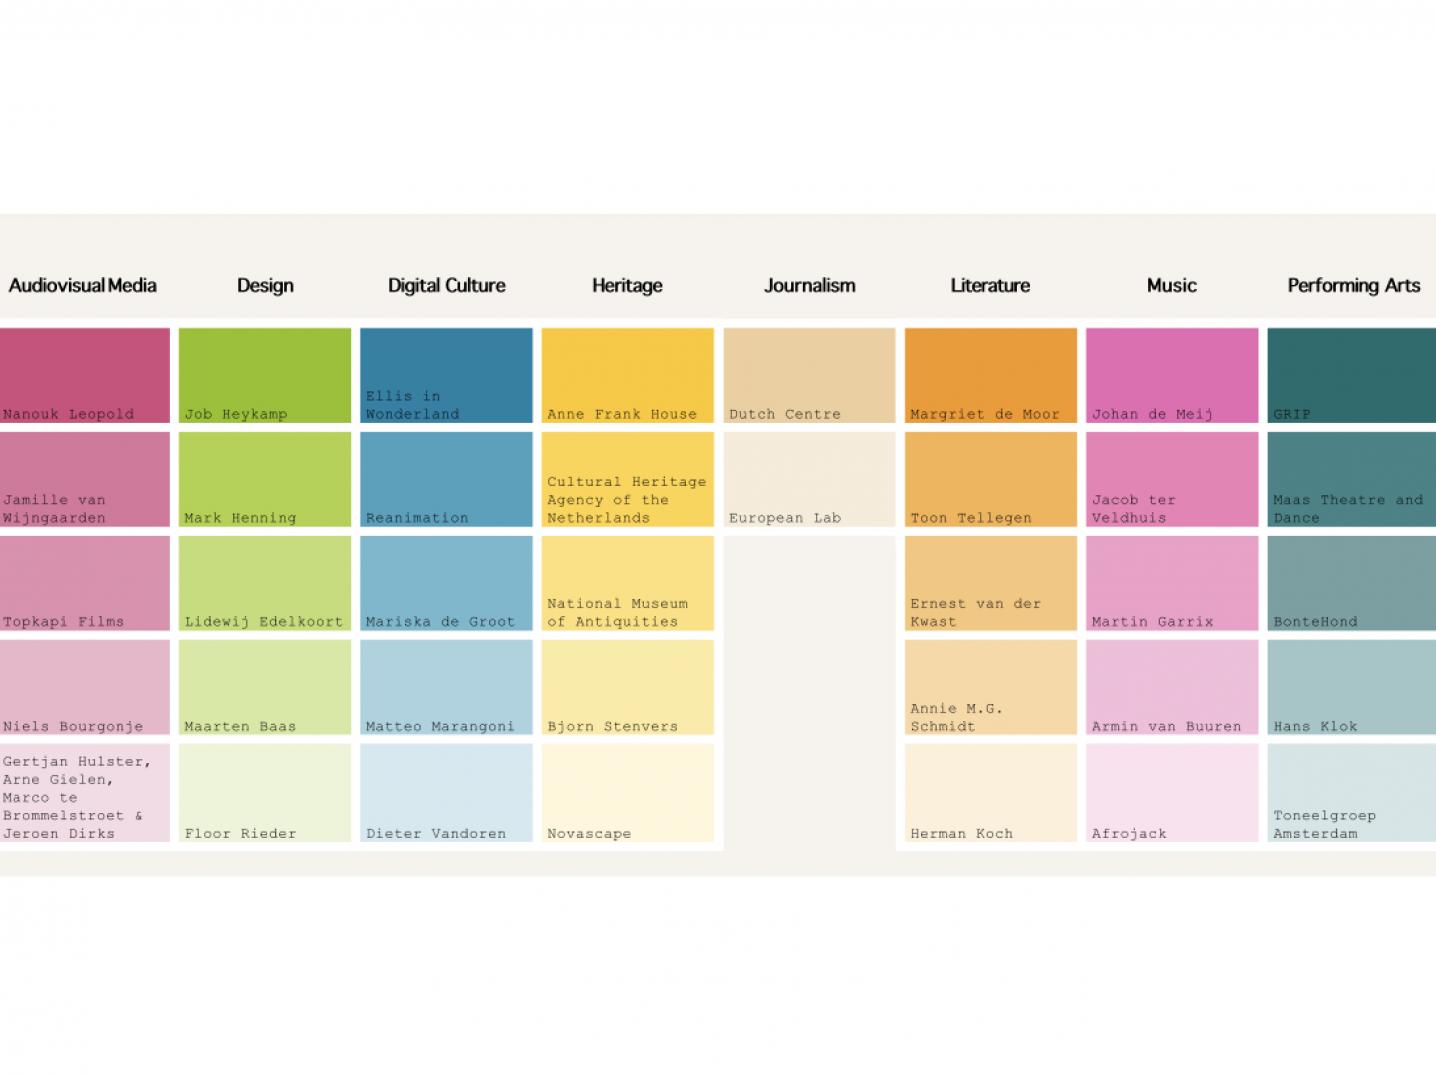
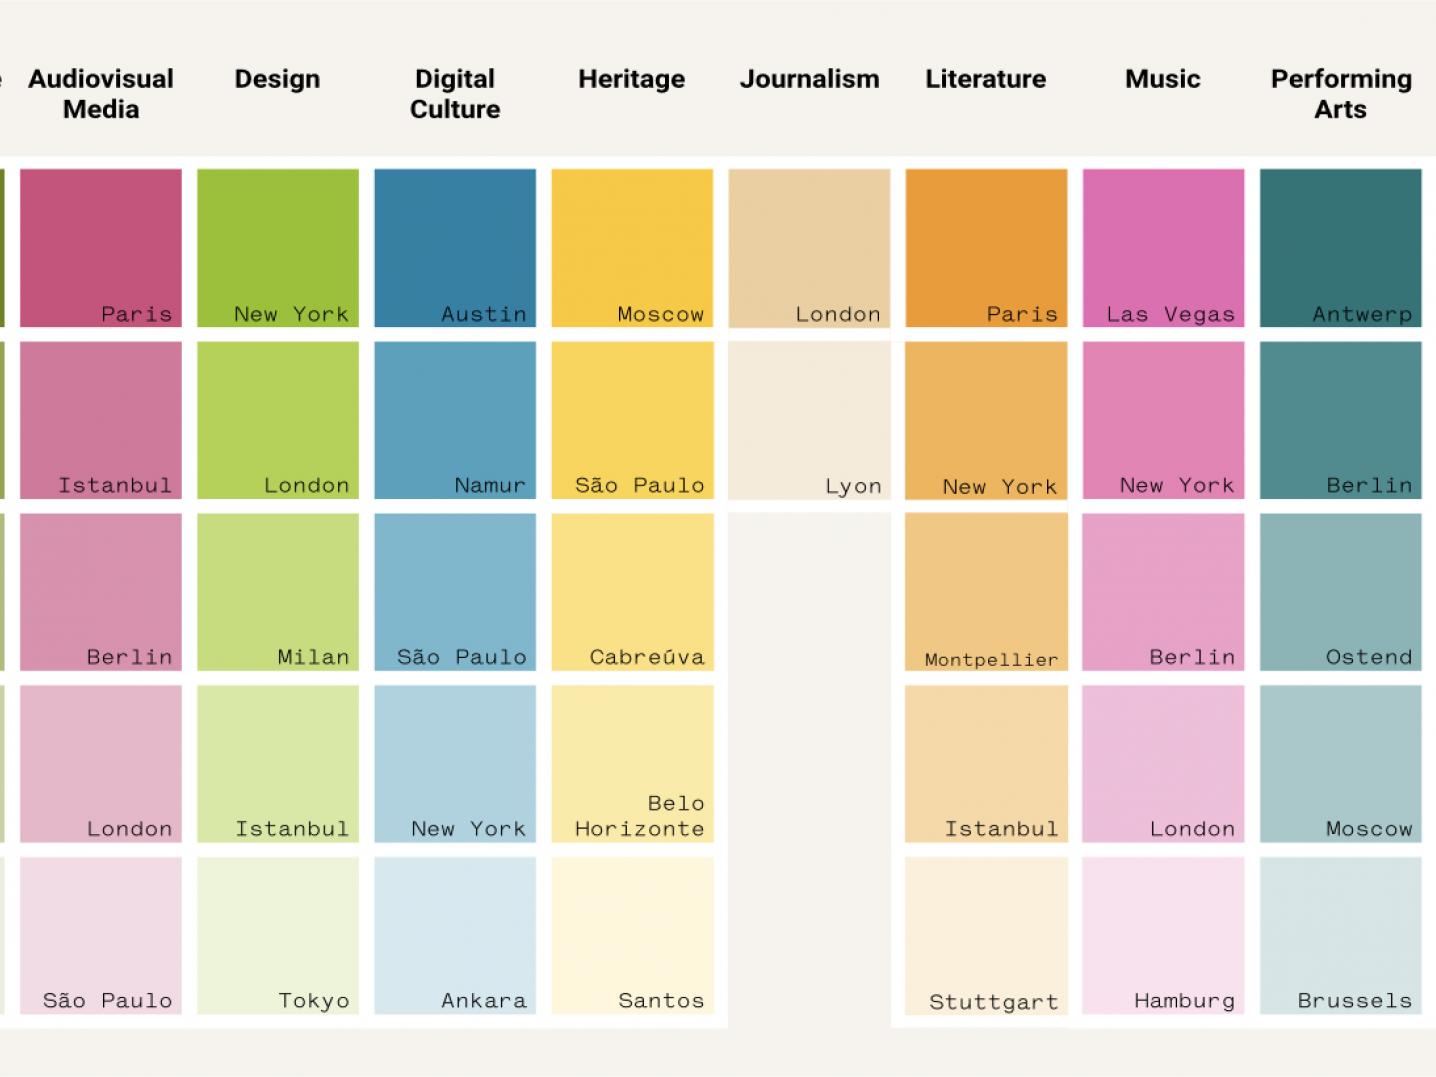
Our data specialist Erin Chang has created two colour pallets, figures 6 and 7, that shows us the most travelled Dutch organisation and the most visited city, per discipline. This gives us great nuances of insight. For example, the top five cities for performing arts are all within Europe, yet four of the top cities for digital culture are outside of Europe. Istanbul is one of the top cities for audio visual media and literature, like Sao Paulo is for heritage, yet the countries Turkey and Brazil don’t make it to the top five.
The data analysis of 2018 gives us big numbers, colourful change and hopefully an eagerness to dig deeper. It also shows us the importance of breaking down the big numbers into details for a better insight. If you want to conduct your own research, this data provides you with the best basis to go theorizing from. Just put on your Sherlock Holmes cap and type one of the frequent travellers or venues from this list into our data base search engine, to find out who else was where and what can be expected for the future.
Check out the complete overview of Dutch cultural activities in 2018 here.
For funding possibilities, check out our Cultural Mobility Funding Guide or the websites of our partners Creative Industries Fund NL, Dutch Film Fund, Dutch Foundation for Literature, EYE International, Het Nieuwe Instituut, Mondriaan Fund, Performing Arts Fund, and the Embassy of the Netherlands in the country you want to work in.
The DutchCulture Database works to collect comprehensive data on as many international events as possible, however the database is not exhaustive. Our analysis is based on the data we are able to collect and may therefore not give a complete image. Find out more about how we collect our data in our Database Disclaimer.


